
Tech Tips From The Bench · Productivity
7 Ways Excel Tables Make Work Easier
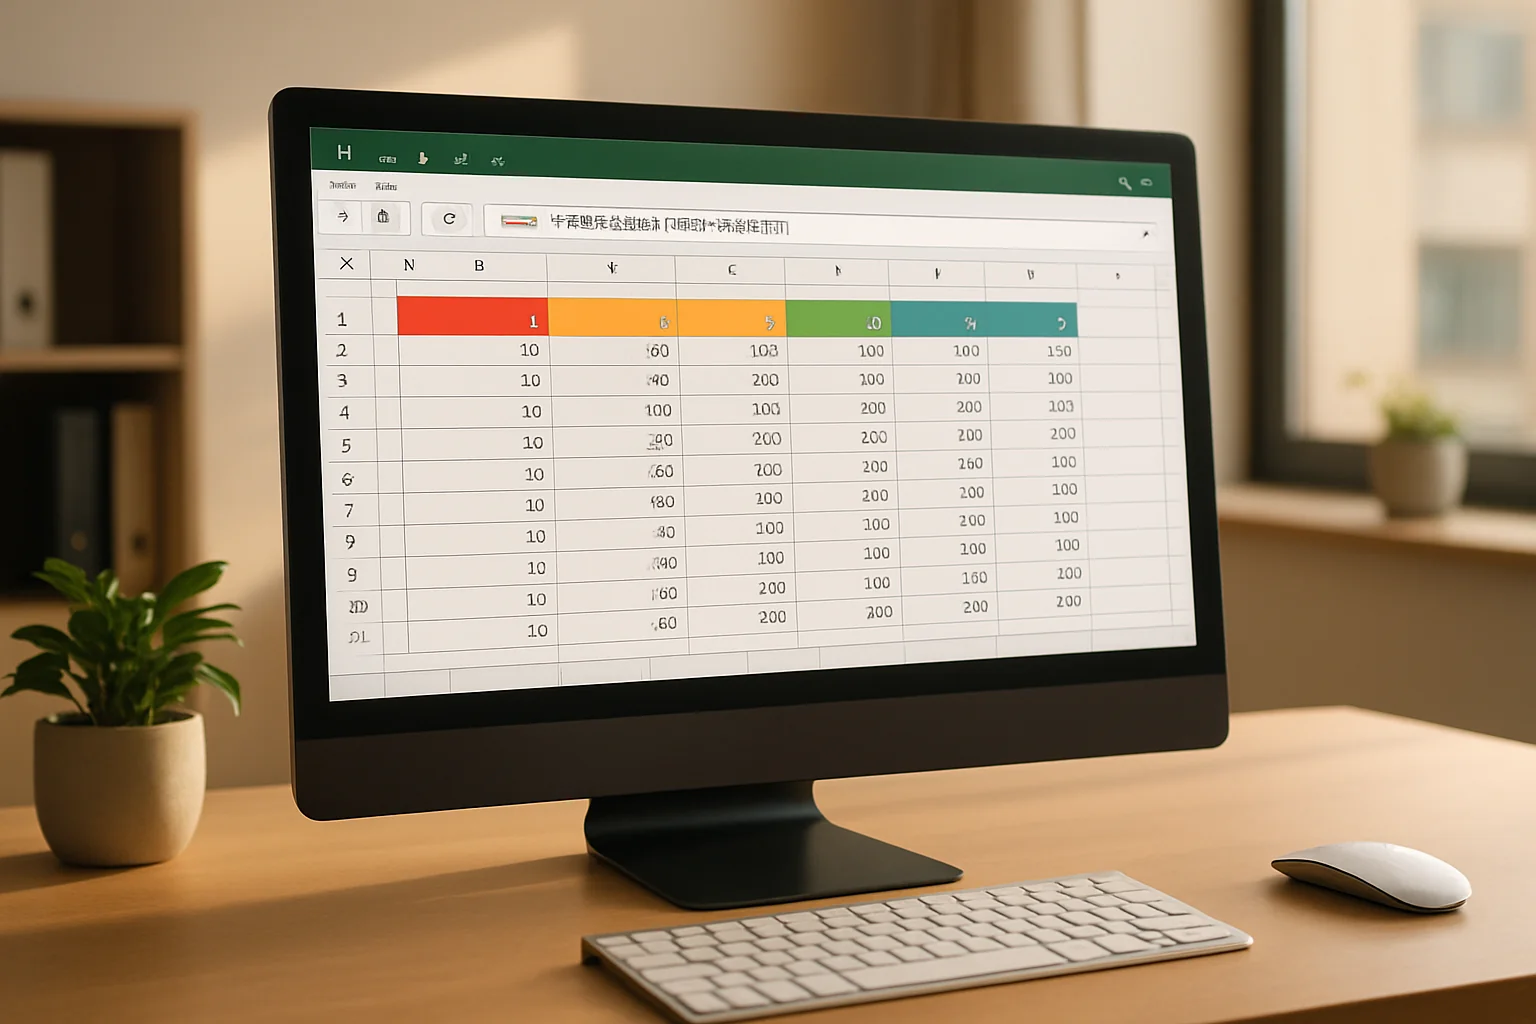

If you’ve ever clicked “Format as Table” in Excel and thought it just made your spreadsheet prettier, you’re missing out on some serious productivity tools. Excel tables are actually powerful data structures that can automate sorting, simplify formulas, create dynamic charts, and save you countless hours of repetitive work. Whether you’re managing inventory for a Turlock business, tracking family budgets, or analyzing sales data, understanding what Excel tables can really do will change how you work with spreadsheets.
What Makes Excel Tables Actually Different
Before we dive into what Excel tables can do, let’s clarify what we’re talking about. An Excel table isn’t just cells with borders and colors—it’s a specific Excel feature you create by selecting your data and pressing Ctrl+T (or going to Insert > Table). When you do this, Excel treats that range as a single, intelligent object with special properties.
The moment you convert a range to a table, Excel adds filter buttons to every column header, gives your table a name (like Table1), and starts tracking it as a structured reference. This might sound technical, but it means Excel now understands your data as connected information rather than just individual cells. That’s where the magic happens.
Auto-Expanding Formulas That Actually Follow Your Data
A calculated column inside a table can fill its formula down the column and extend it to new rows. An arbitrary formula outside the table does not gain that behavior just because it is nearby.
Let’s say you’re tracking customer orders and you have a “Subtotal” and “Tax” column, and you want a “Total” column that adds them. In a normal range, you’d write the formula once, copy it down, then remember to copy it again every time you add a row. With a table, you type the formula once in the first cell of your Total column, and Excel instantly fills it down to all existing rows AND automatically adds it to any new rows you create.
- No more forgotten formulas.Add a row anywhere in your table, and calculated columns fill automatically—no copying and pasting required.
- Formulas stay consistent.Calculated columns encourage consistent formulas, but individual cells can still be changed. Check for exceptions before trusting the results.
- Works with complex calculations.Many formulas work in calculated columns. Spilled dynamic-array formulas are not supported inside tables; place them outside the table.
Structured References Make Formulas Readable
Here’s something that makes troubleshooting spreadsheets so much easier: Excel tables use column names instead of cell references in formulas. Instead of writing =B2*C2, you write =[@Price]*[@Quantity]. Instead of =SUM($B$2:$B$500), you write =SUM(Sales[Revenue]).
When we’re helping Turlock residents with software problems and data issues, clear names can help make a formula easier to read. In Sales[Revenue], Sales is the table name and [Revenue] identifies its data column; @ identifies the current row.
Even better, these references automatically adjust when you rename columns. Change “Price” to “Unit Cost” in the header, and every formula using that column updates instantly. No find-and-replace, no broken formulas, no hunting through worksheets to fix references.
Charts and Pivot Tables That Update Themselves
Creating a chart from an Excel table creates a dynamic connection. Add new rows to your table, and the chart automatically includes the new data—no need to edit the chart’s data range or recreate anything.
The same goes for pivot tables. When you build a pivot table from a table (rather than a regular range), refreshing the pivot picks up new rows automatically. For businesses in Turlock tracking sales, inventory, or customer data, this means your dashboard stays current without manual updates every time you add information.
- Create your table firstSelect your data range and press Ctrl+T to convert it to a table, giving it a meaningful name like “MonthlySales” in the Table Design tab.
- Build your chart or pivotCreate your chart or pivot table as you normally would, but select the table as your data source instead of a cell range.
- Add data anytimeSimply add new rows to your table, and your charts update immediately—pivot tables update when you click Refresh.
Powerful Filtering Without Extra Steps
Excel tables come with filter buttons built into every column header from the moment you create them. Click any dropdown arrow and you can instantly filter or sort by that column. But tables take this several steps further than normal filtering.
First, table filters remember your structure even when you filter. Your formulas don’t break, your formatting stays intact, and subtotal rows (if you use them) automatically adjust to show only filtered results. Second, you can filter multiple columns simultaneously and Excel shows you exactly which columns have active filters with a small icon.
- Quick data exploration.Click through different filter combinations to answer questions about your data in seconds without writing complex formulas.
- Safe filtering.Unlike filtering normal ranges where you might accidentally include or exclude headers, table filters always keep your header row visible.
- Clear filter states.You can instantly see which columns are filtered and clear all filters with one click using the Clear button on the Data tab.
The Total Row That Knows What You Need
Turn on the Total Row (check the box in Table Design) and Excel adds a special row at the bottom of your table with dropdown menus in each column. These dropdowns let you instantly apply functions like Sum, Average, Count, Min, or Max to that column—no formulas to write.
The brilliant part: the Total Row uses SUBTOTAL functions automatically, which means it only calculates visible rows when you filter your data. Filter your sales table to show only March, and the Total Row instantly shows March totals—not the grand total of all months. This is exactly the behavior you want but would take significant formula work to achieve manually.
For Central Valley businesses managing customer lists, inventory, or financial data, this feature alone justifies using tables. You can answer questions like “What’s the average order value for customers in Turlock?” by filtering to Turlock zip codes and clicking Average in the Total Row—takes about five seconds.
Better Data Management and Duplicate Control
Excel tables integrate seamlessly with other Excel data tools. Remove Duplicates works with tables, but permanently removes selected duplicate records. Save a copy and verify which columns identify a duplicate first. Data validation rules are easier to apply across entire columns. And if you’re using Excel’s newer features like Power Query or Power Pivot, they’re designed to work with tables as their native data format.
A table can make a consistently structured list easier to sort, filter and maintain. Check duplicates, required values and data types; converting to a table does not clean or validate the contents by itself.
If you’re working with imported data—maybe from your point-of-sale system, online orders, or another database—converting it to a table as your first step makes everything that follows easier. Need help getting your business data organized properly? Our team can show you how during a consultation at our shop or help troubleshoot Excel issues that are slowing you down.
Converting Your Existing Spreadsheets to Tables
Ready to start using tables? The conversion process is straightforward, but there are a few things to check first to avoid issues.
- Clean your data firstMake sure you have headers in the first row, no completely blank rows or columns in the middle of your data, and consistent data types in each column.
- Select and convertClick anywhere in your data range, press Ctrl+T (or go to Insert > Table), confirm the range is correct and that “My table has headers” is checked, then click OK.
- Rename your tableGo to the Table Design tab that appears and change the table name from “Table1” to something descriptive like “CustomerOrders” or “InventoryList.”
- Explore table featuresTry filtering, add a calculated column, turn on the Total Row—experiment with the features to see how they work with your specific data.
The biggest mistake people make is trying to use tables with data that has merged cells, irregular spacing, or mixed data types. If your conversion doesn’t work properly, it’s usually because the source data needs cleaning first. Check the source layout before trying again, and test a copy if the workbook contains important calculations.
Frequently asked questions
Will converting my spreadsheet to a table mess up my existing formulas?
Converting a range to a table does not automatically rewrite existing cell references as structured references. Save a copy and test key calculations. See Microsoft’s structured-reference guide.
Can I use Excel tables if I share files with people using older versions of Excel?
Tables are supported in modern Excel versions, but older file formats and versions can lose features. Use the Compatibility Checker when sharing with older software and test the workbook in the recipient’s version.
Do Excel tables slow down large spreadsheets?
Performance depends on workbook size, formulas, data connections and hardware. A table is not a guaranteed speed improvement. Measure a copy of your actual workbook before and after changes.
Can I convert a table back to a normal range if I need to?
Select a table cell, open Table Design and choose Convert to Range. Data and formatting remain, while table features are removed and structured references become ordinary cell references. Keep a backup: converting it back will not automatically restore the original structured formulas.
Need Help With Excel or Other Software Issues?
For help with a computer problem, call Turlock Computer Repair at (209) 661-9171 or use the repair booking page.
3 Responses